14 Maps
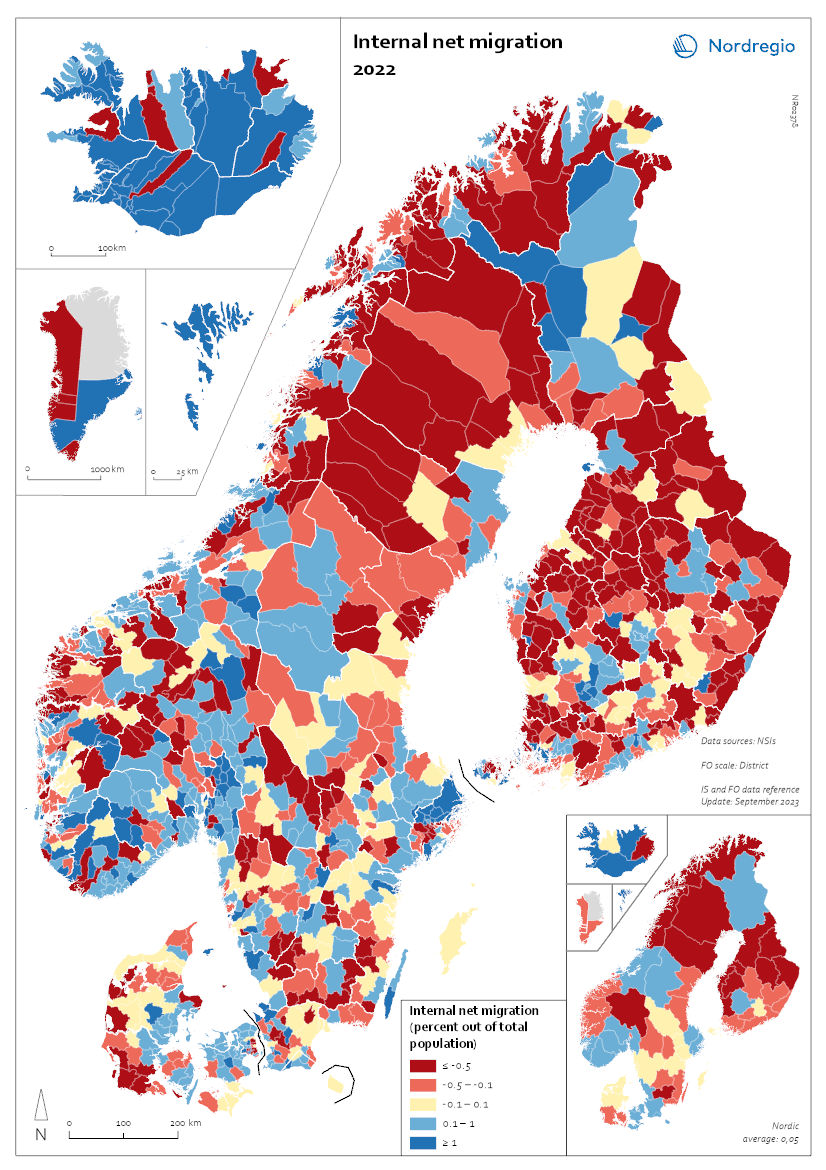
Internal Migration 2022
This map shows the internal net migration in 2022 as a percentage of the total population. This map shows the internal net migration in 2022 as a percentage of the total population. The small map shows the result on a regional level, and the big map on the municipal level. Internal (sometimes referred to as domestic) net migration refers to migration between municipalities and regions within the same country. International migration is excluded. In 2022, internal net migration was positive (indicated by shades of blue) or at least balanced (shown in yellow) in several municipalities in central and southern Sweden and Norway, as well as in central and northern Finland – areas that traditionally were more likely to lose population due to internal migration. Conversely, several municipalities in the capital regions – such as Stockholm, Oslo, and Copenhagen – exhibited negative internal net migration. Several municipalities across the Nordic Region, including in more remote and rural areas, continued to register positive internal net migration in this year. In Iceland, positive migration predominated in most of the municipalities, and the Faroe Islands also presented positive net migration. Greenland oscillated mainly between positive and negative migration flows, while Åland presented the whole spectrum of positive, balanced, and negative net migration for this year.
 2025 April
 - Demography
- Nordic Region
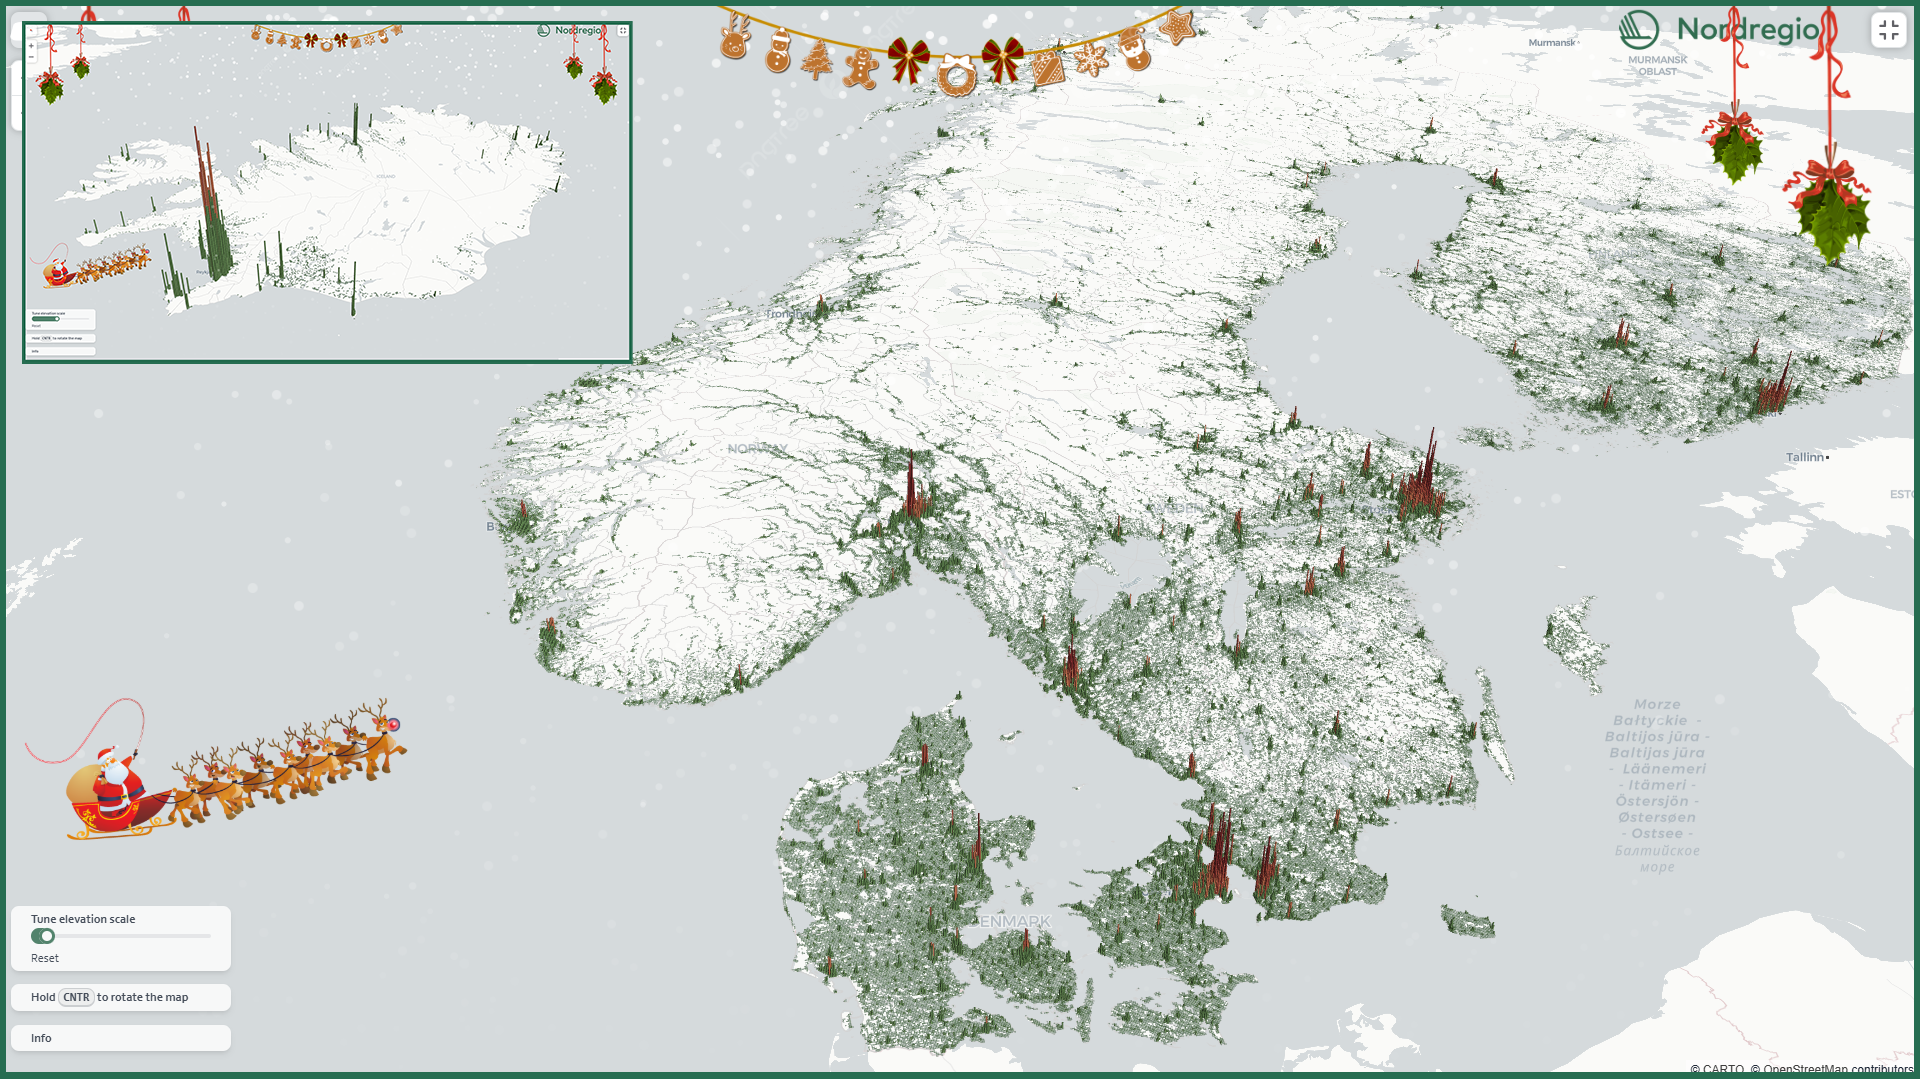
A 3D population map for the holiday season
This Christmas, we’re gifting all fellow data nerds our first-ever interactive 3D map! The map displays the number of residents in each 1km grid cell, with the height of the bars representing the number of residents in each area.
- 2024 December
- Demography
- Nordic Region

Voting turnout in national elections
Voting turnout in 2023 (or latest national election). The map illustrates voter turnout as a percentage point relative to national averages, highlighting differences in participation levels between countries. This method removes inter-country differences in participation levels, providing a clearer view of the urban-rural divide. Lower turnout is observed in eastern Finland, northern Sweden, and the more rural parts of Denmark. In Norway, the lowest turnout occurs in the north and in municipalities outside Oslo. Nationally, the highest voter turnouts are in the Faroe Islands (88%), Sweden (84.2%), and Denmark (84.16%). Lower participation rates are found in Iceland (80.1%), Norway (77.2%), Finland (68.5%), and Greenland (65.9%).
- 2024 May
- Nordic Region
- Others
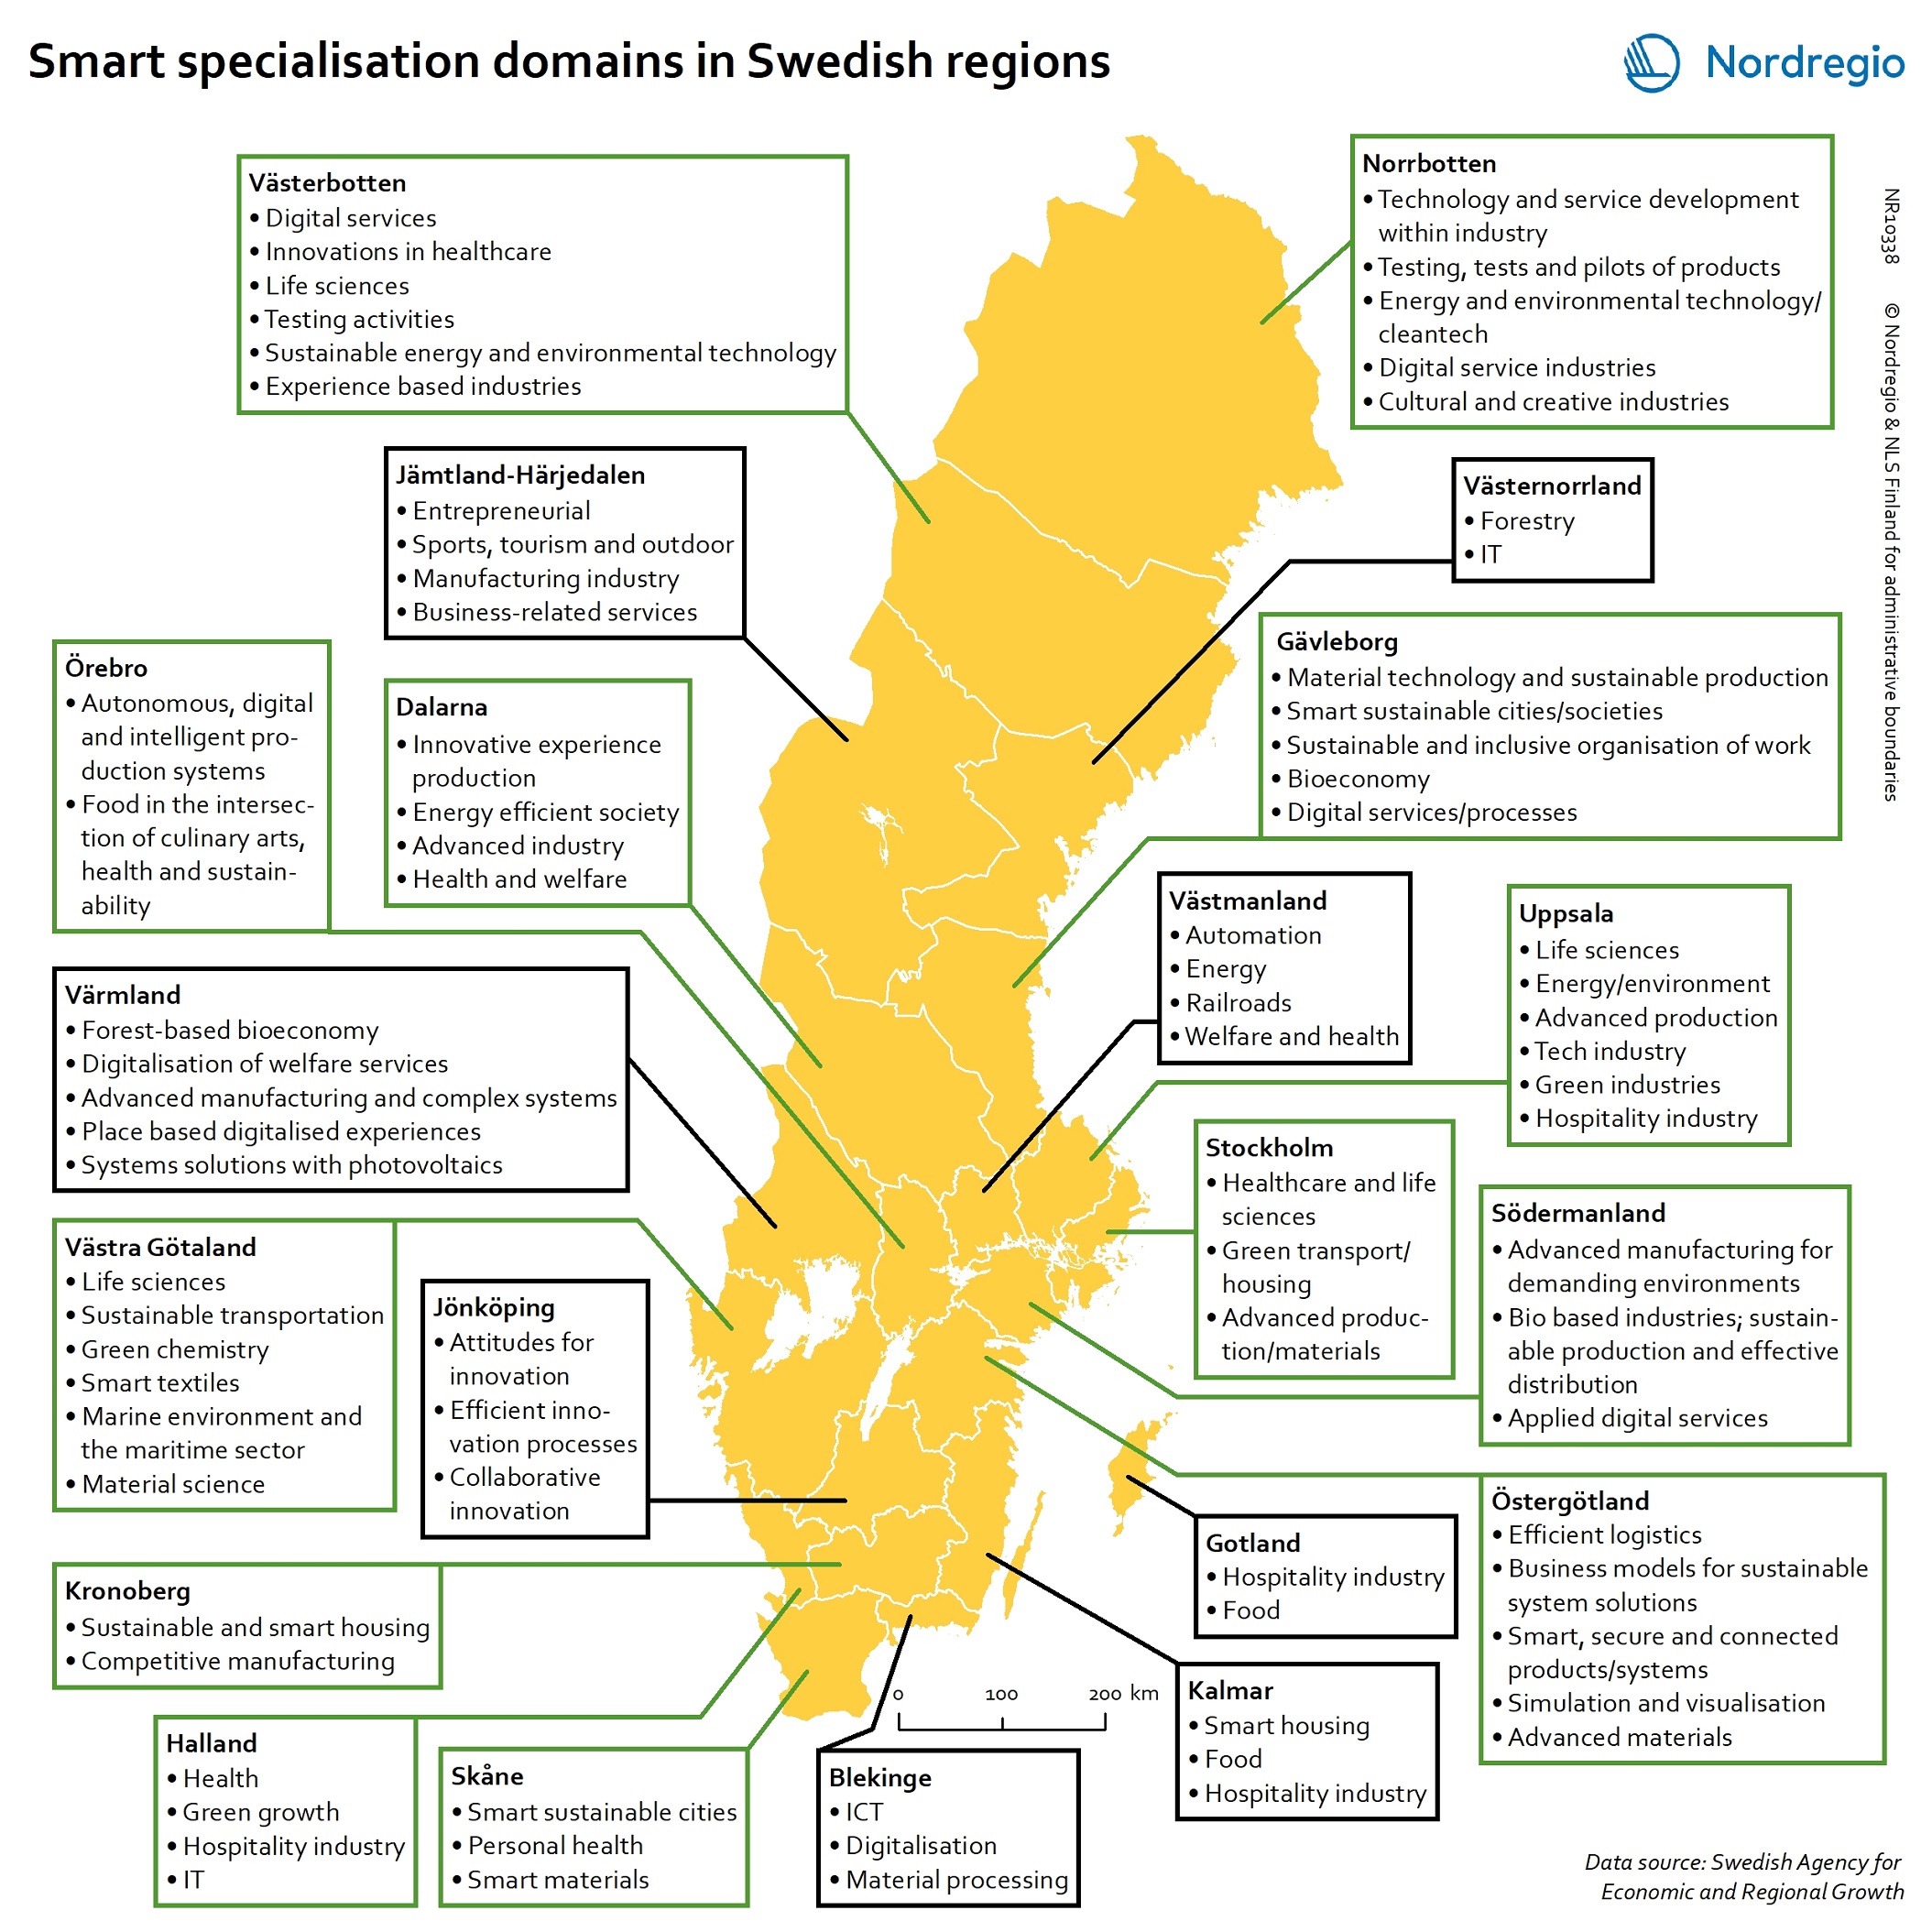
Smart specialisation domains in Swedish regions
This map gives an overview of the S3 focus areas in the Swedish regions in 2019. The major S3 domains in Sweden shown in the map provide a good overview of the key specialisation areas in Sweden. It is possible, for example, to check which Swedish regions have “green”, “sustainable”, “environment” at their smart specialisation domains (marked in green in their respective infoboxes for the domains in the figure). The information illustrated in the map can assist Swedish regions when they are considering opportunities for S3 synergy and co-operation with each other. In Sweden, the Swedish Agency for Economic and Regional Growth (Tillväxtverket) is a central actor in assisting regions in their work with smart specialisation. Tillväxtverket promotes opportunities for cooperation between the Swedish regional S3 processes and provides relevant information and learning seminars related to S3. Read the digital publication here.
- 2020 February
- Economy
- Research and innovation
- Sweden
