
This map shows the median household disposiable income measured in purchasing power standard (PPS) in Nordic municipalities (big map) and regions (small map) in 2022.
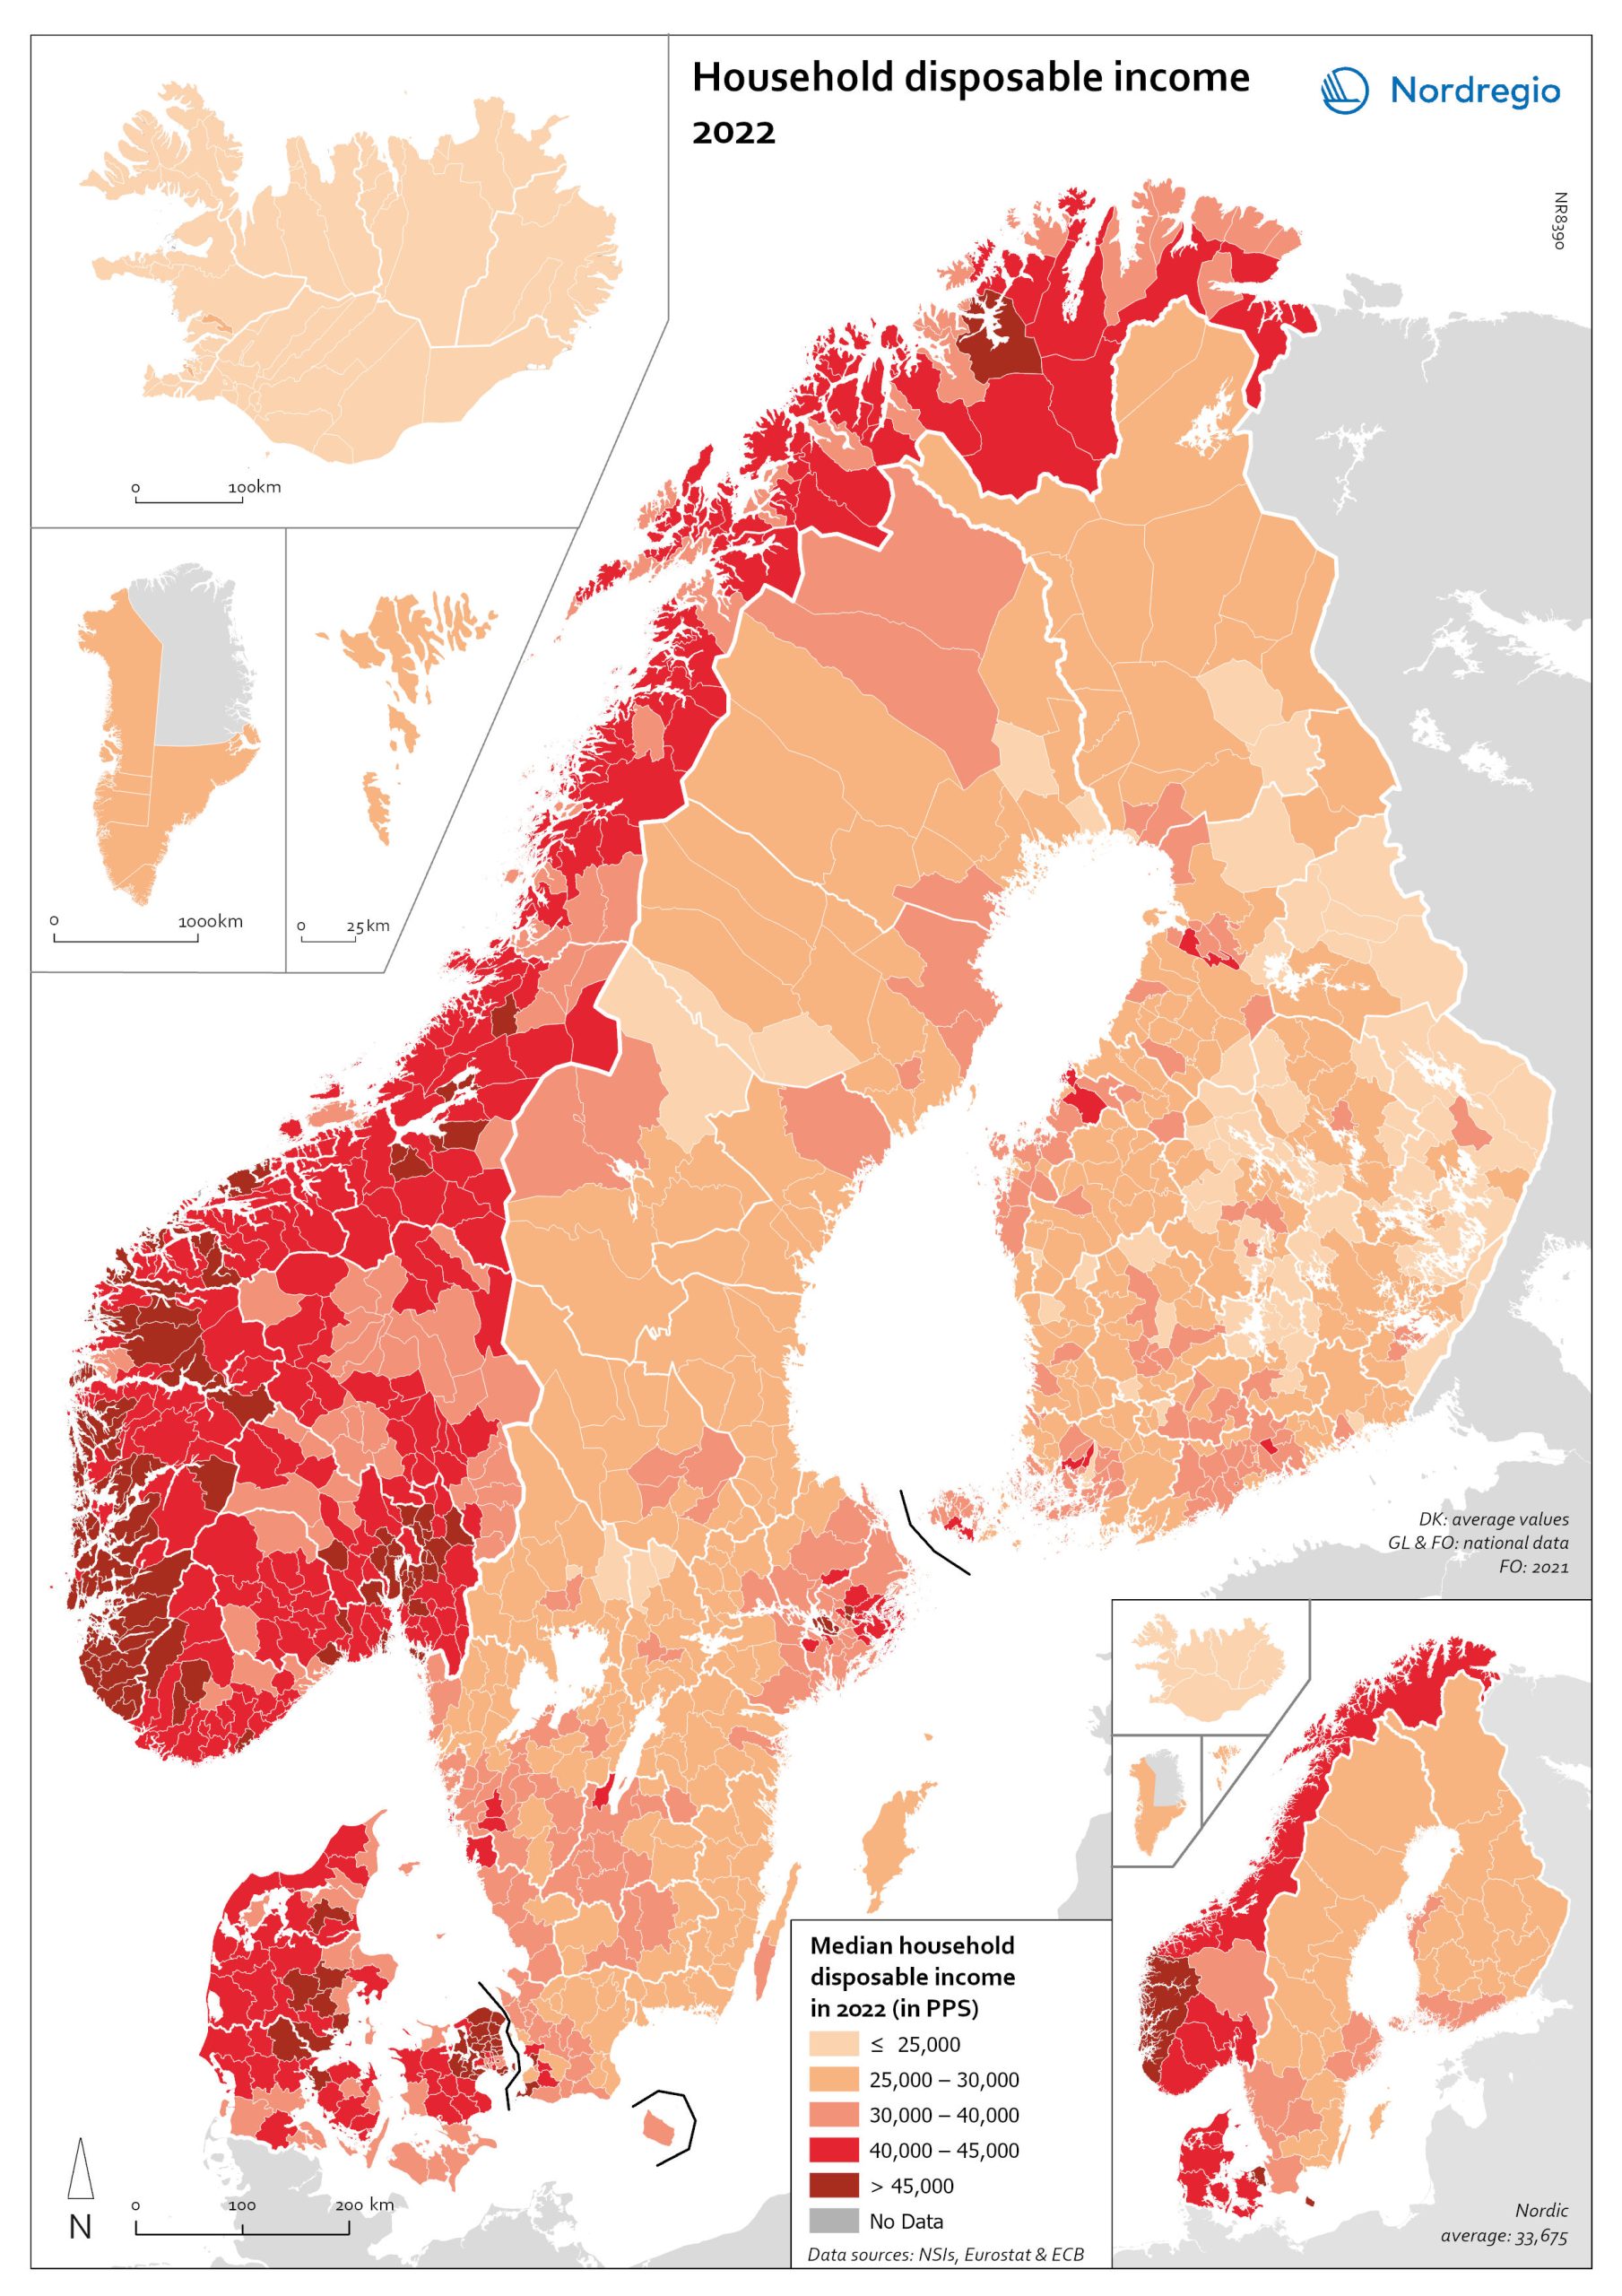
Household disposable income per capita is a common indicator of the affluence of households and, therefore, of the material quality of life. It reflects the income generated by production, measured as GDP that remains in the regions and is financially available to households, excluding those parts of GDP retained by corporations and government. In sum, household disposable income is what households have available for spending and saving after taxes and transfers. It is ‘equivalised’ – adjusted for household size and composition – to enable comparison across all households. Purchasing Power Standards (PPS) is used to compare the countries’ economies and the cost of living for households.
The map shows the intra-municipal differences in household disposable income in PPS, which reveals the different patterns in the Nordic countries. Norwegian coastal municipalities have slightly higher household disposable income than inland municipalities, with some exceptions. Finnish, Icelandic, and Swedish municipalities generally have much lower household disposable income compared to Norwegian and Danish municipalities, except for the larger urban areas. In Denmark, most municipalities are at a similarly high level, except for remote islands in the south. The differences between the Icelandic municipalities are rather small, at a medium to lower level.