This map shows the natural population change per 1,000 persons in 2022.
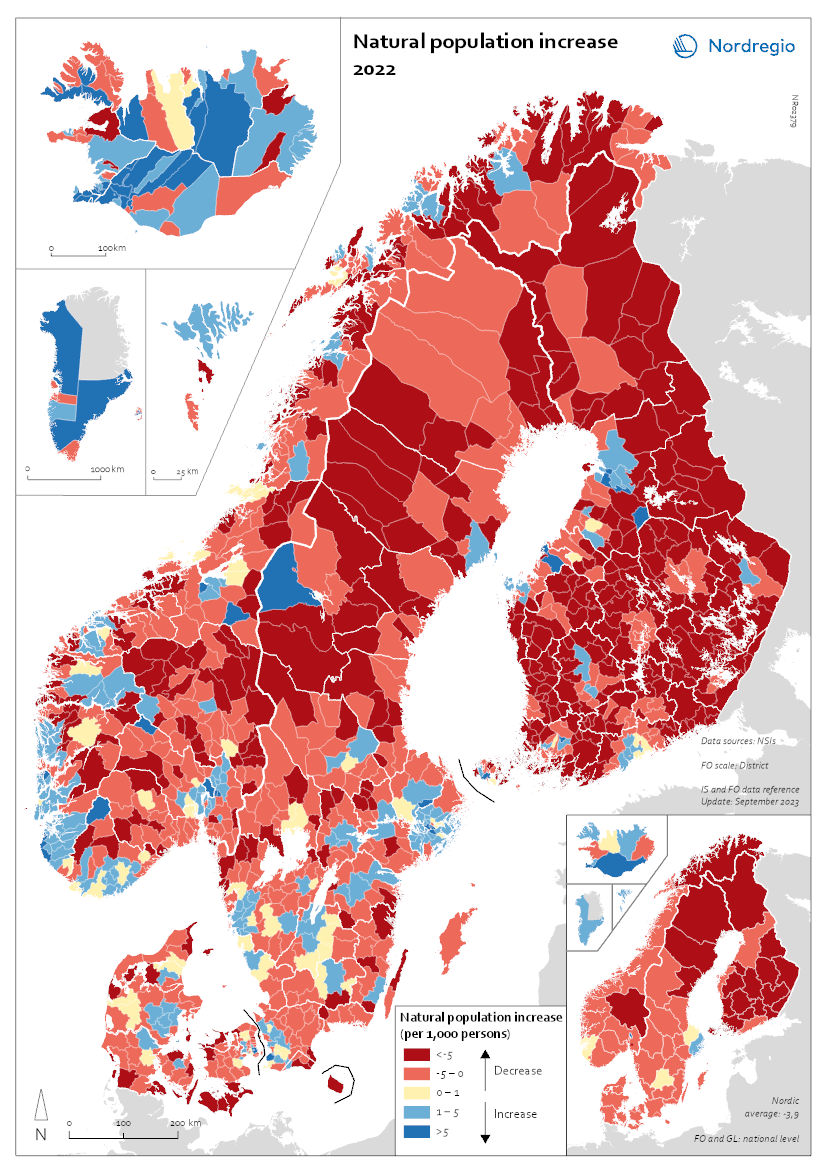
This map shows the natural population change per 1,000 persons in 2022 (i.e. between 1 Jan and 31 Dec 2022). Natural population change refers to births minus deaths (i.e. population change disregarding migration). The small map shows the result on a regional level, and the big map shows changes on the municipal level. Red shades refer to population decrease, blue shades to population increase, and yellow shades to balanced development.
The map shows that levels of natural population change do not only vary across but also within the Nordic countries. Urban areas such as Stockholm and Gothenburg in Sweden; Oslo and Bergen in Norway; Copenhagen and Aarhus in Denmark; as well as Helsinki and Turku in Finland all experienced positive natural population change. This can be attributed to the comparatively young population age structure of these urban centres. Young people of child-bearing age often cluster in cities for study and work, and many start families there. By contrast, rural and remote areas often have a higher proportion of older people and, as such, tend to register more deaths than births, resulting in negative natural population change. These patterns are particularly pronounced in Finland but also in the northern parts of Sweden and Norway.
Nonetheless, there are exceptions. In Iceland, Greenland, and the Faroe Islands, which had comparatively high levels of natural population growth at national level, a majority of municipalities, including many in rural areas, still registered more births than deaths in 2022 (77% of municipalities in Iceland, 60% in Greenland, 67% on the Faroe Islands). In the other Nordic countries, only a minority of municipalities, mostly in urban centres, recorded natural population increase in 2022 (30% in Norway and Sweden, 26% in Denmark, 12% in Finland).