


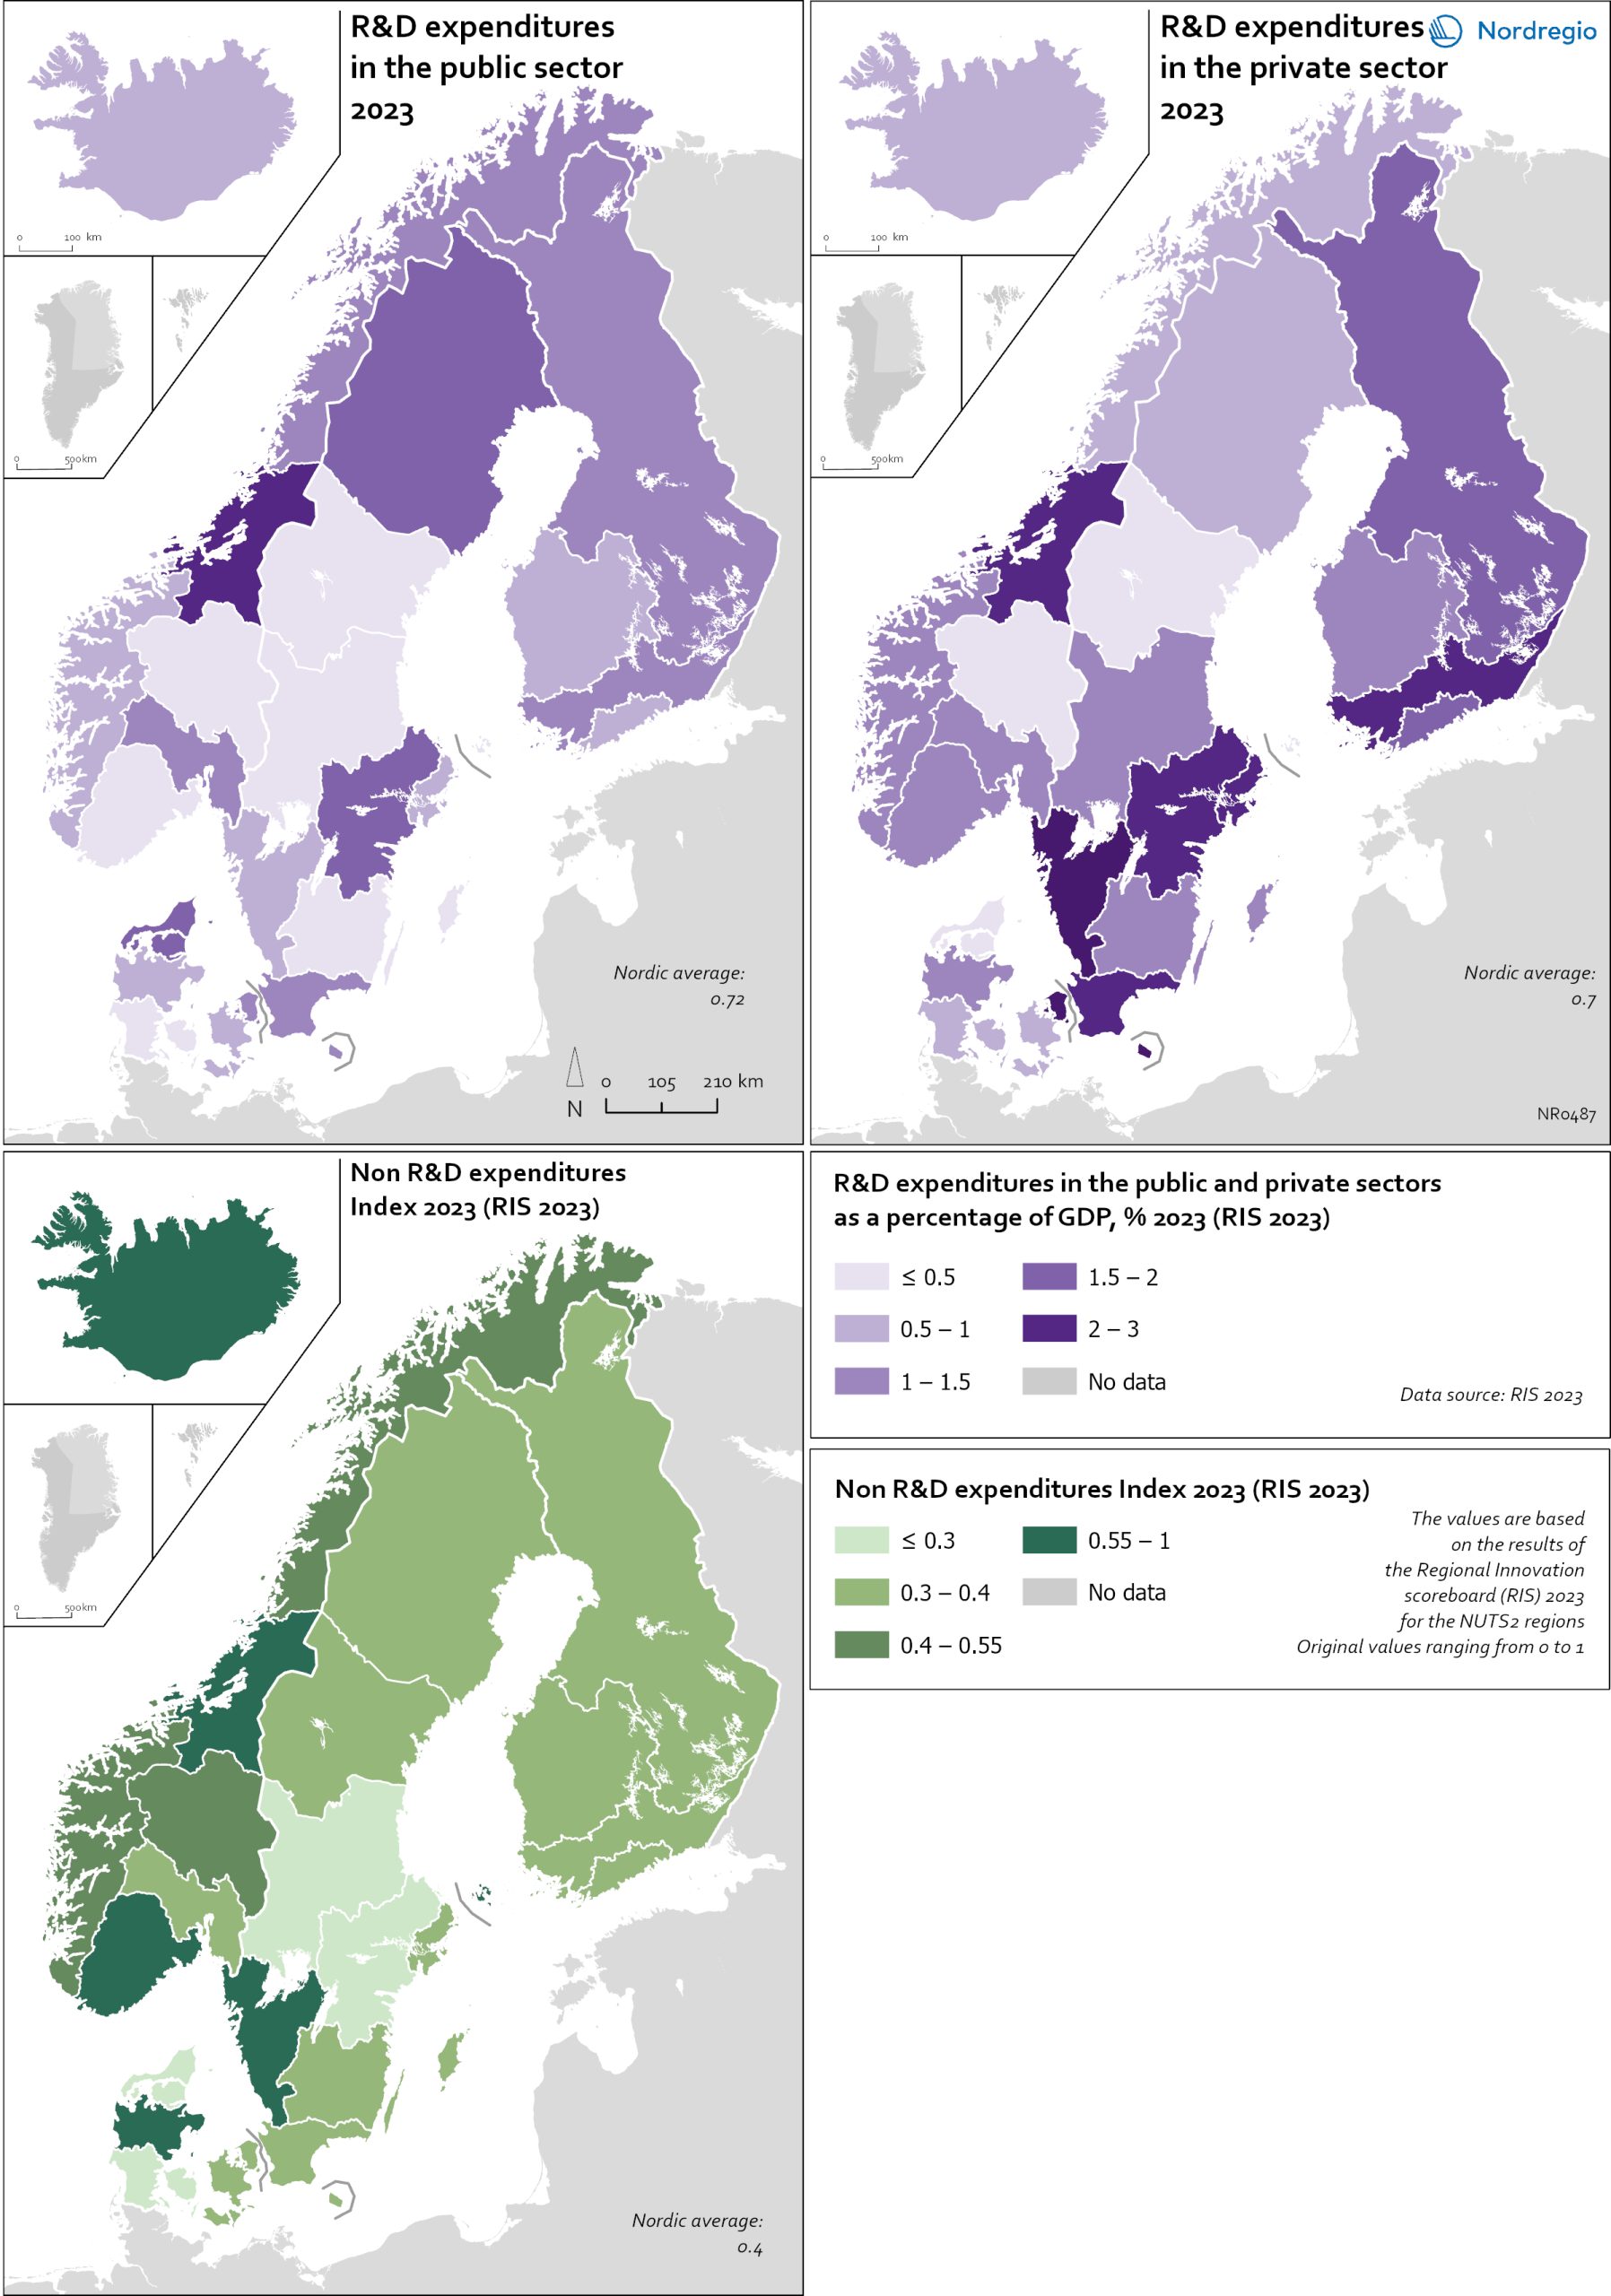
These maps shows the expenditure on Research and Development (R&D) in the public and business sectors as a percentage of regional GDP, along with non-R&D innovation expenditure in Small and Medium Enterprises (SMEs) as a percentage of turnover.
Together, these metrics offer a comprehensive understanding of the innovation landscape and provide insights into governments’ and higher education institutions’ commitment to foundational research, as well as the competitiveness and dynamism of the business environment and SMEs’ innovation capacity. By considering investment in both R&D and non-R&D activities, these indicators illustrate a broad spectrum of innovation drivers, from basic research to market-driven initiatives, and underscore the diverse pathways through which innovation fosters economic growth and social progress
First, the top left map showcases R&D expenditure in the public sector as a percentage of GDP in the Nordic countries in 2023. In that year, the European level of R&D expenditure in the public sector, as a percentage of GDP, was 0.78%. By comparison, the Nordic average was 0.9%. While the more urban regions, in general, lead the Nordic regions, this is not always the case, as shown by the variation between the frontrunners.
The leading region is Trøndelag (including Norway’s third-largest city, Trondheim), with 2.30% of regional GDP. It is in third place in the EU as a whole. The next regions are Övre Norrland with 1.77%, Northern Jutland with 1.54%, Östra Mellansverige with 1.52%, and Hovedstaden with 1.49%. A common feature of most of the top-ranking regions is that they host universities and other higher education institutions known for innovation practices. Most Nordic regions have not seen significant increases or decreases in public R&D spending between 2016 and 2023.
The top right map focuses on the private sector’s investment in research and development activities and depicts R&D expenditure in the business sector as a percentage of regional GDP. A higher percentage suggests a greater emphasis on innovation by businesses, potentially leading to the creation of new products, processes, and markets. The Nordic average is 1.45% in 2023, slightly below the European average of 1.51%.
The highest percentages are found in regions with larger cities. The top three Nordic regions with the highest R&D expenditure in the business sector as a percentage of GDP are Västsverige at 4.2%, Hovedstaden at 3.1%, and Trøndelag at 2.7%. In Finland, the leading region is Etelä-Suomi with 2.55%. Iceland is represented by a national assessment, with 1.98% of GDP. In Sweden, three other regions also scored quite highly: Sydsverige with 2.5%, Stockholm with 2.45% and Östra Mellansverige with 2.4%.
Lastly, bottom left map depicts non-R&D innovation expenditure in SMEs as a percentage of turnover, with values normalised between 0 and 1. This perspective captures innovation activities beyond traditional R&D, such as investments in design, marketing, training, and organisational innovation within SMEs. It highlights the importance of non-technological innovation in driving competitiveness and growth, especially for SMEs that may lack the resources for large-scale R&D initiatives
The Nordic average is 0.4, the European is 0.53. The leader for this indicator is Åland with 0.73, followed by all regions in Norway (except for the two inland ones), ranging from 0.52 to 0.6, Midtjylland in Denmark with 0.56 and Gothenburg in Sweden with 0.59. The lowest values are seen at Nordjylland in Denmark with 0.27, Norra Mellansverige in Sweden with 0.28, Östra Mellansverige in Sweden with 0.3 and Syddanmark in Denmark with 0.31.
In total, these three innovation measures show varying regional trends in innovative activities among the Nordic regions. While it is usually the most urban regions that are associated with a higher level of innovative activities across the three measures, a number of non-urban regions appear to be specialising in various types of innovation.